Personal
Data, building, sport, coaching, and tutoring. Hover to look, click to keep it open.
A good chart is not a summary of an argument, it is the argument, and the difference shows. I care about the craft of one the way other people care about a well-set page: what the axis admits, what the colour is doing, whether the thing a reader notices first is the thing that matters. Most of what I have built — the injury review, the salary and valuation maps, the coursework, the statistical consulting — came out of wanting to see a question rather than read about it.
The habit runs past the work. I would rather have a distribution than an impression, and I will usually go looking for one: what a lift actually did across a training block, what a season looks like once you control for minutes, what a practice is really earning per payor. Not everything worth knowing is countable, but far more of it is than people assume, and the counting is where the surprises live.
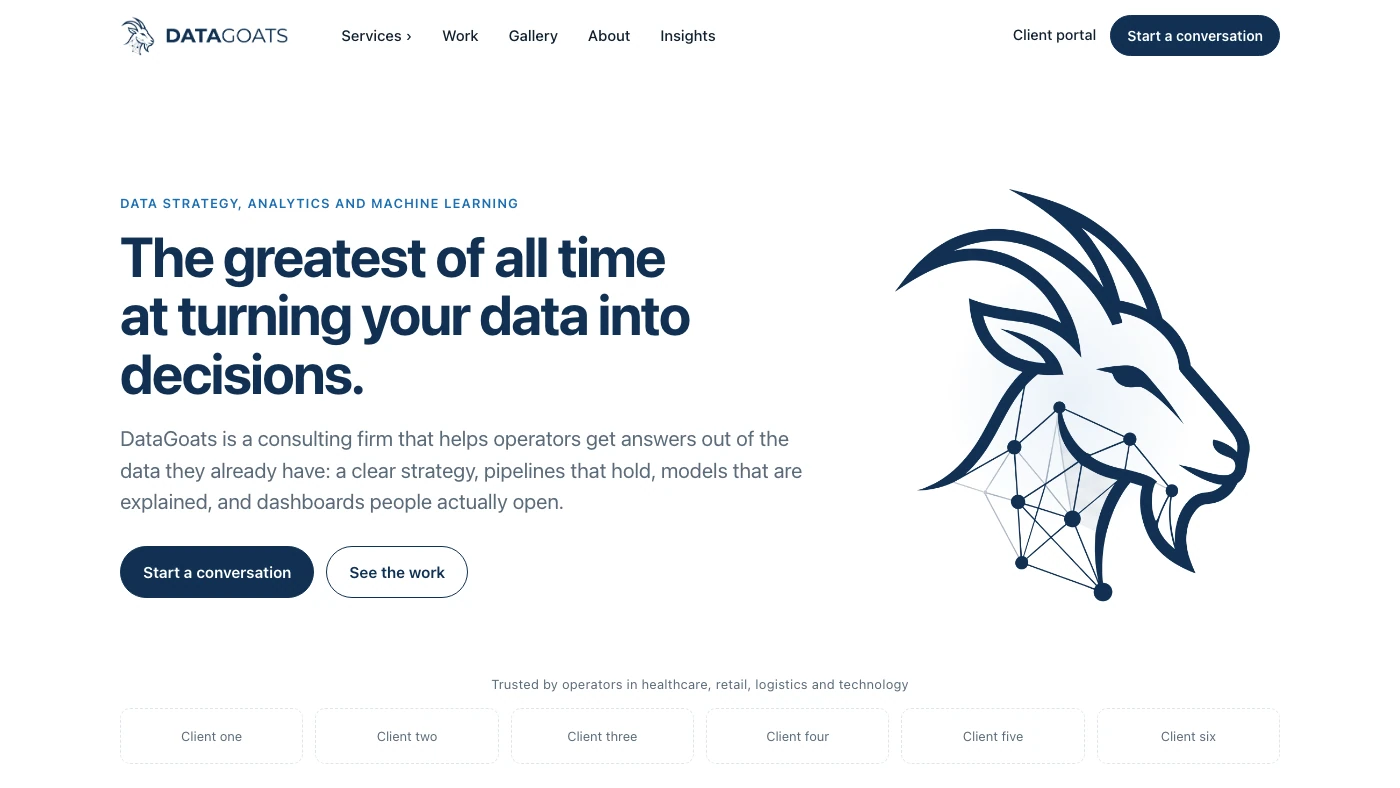
DataGoats is that instinct built out as a firm. It is a concept rather than a company — a full site, a pitch, a working demo and a business plan for a data consulting practice aimed at companies too small to hire a data team — and it is the most complete thing here, because it is the one I would actually want to exist.
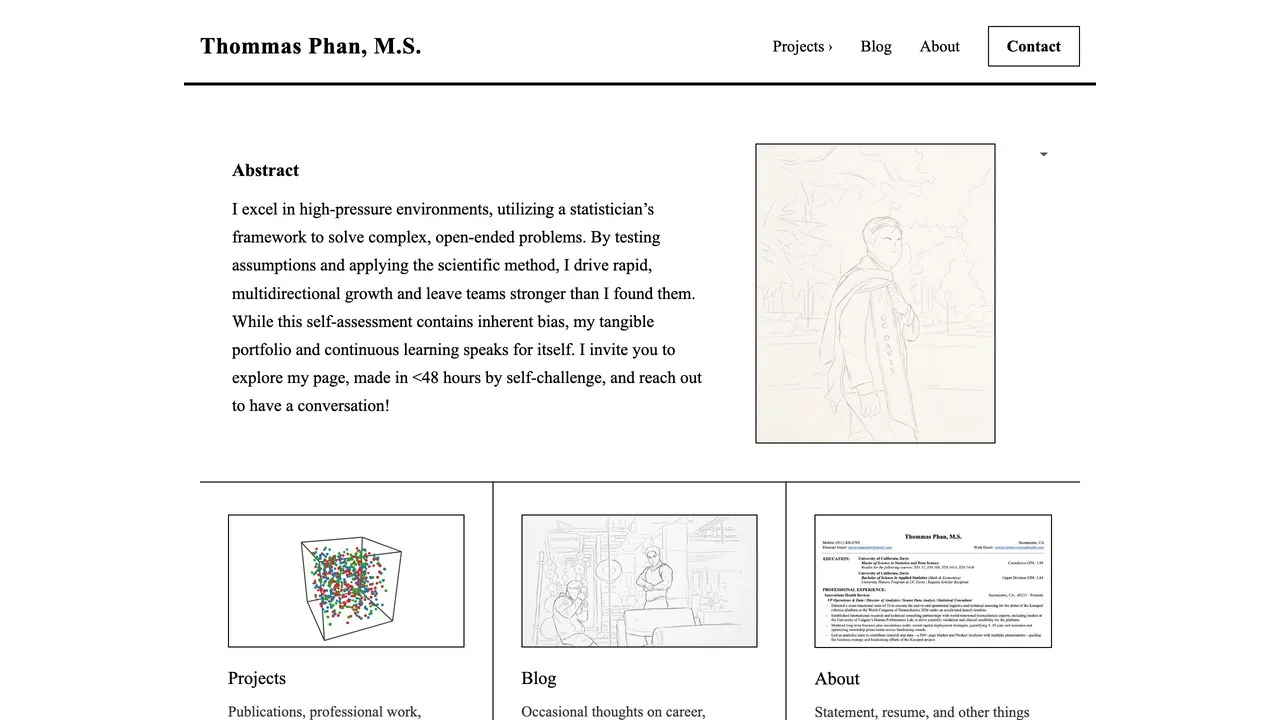
This site is the current one: a Next.js build set in Times New Roman, borrowing its structure from academic journals and newspapers rather than from portfolio templates.
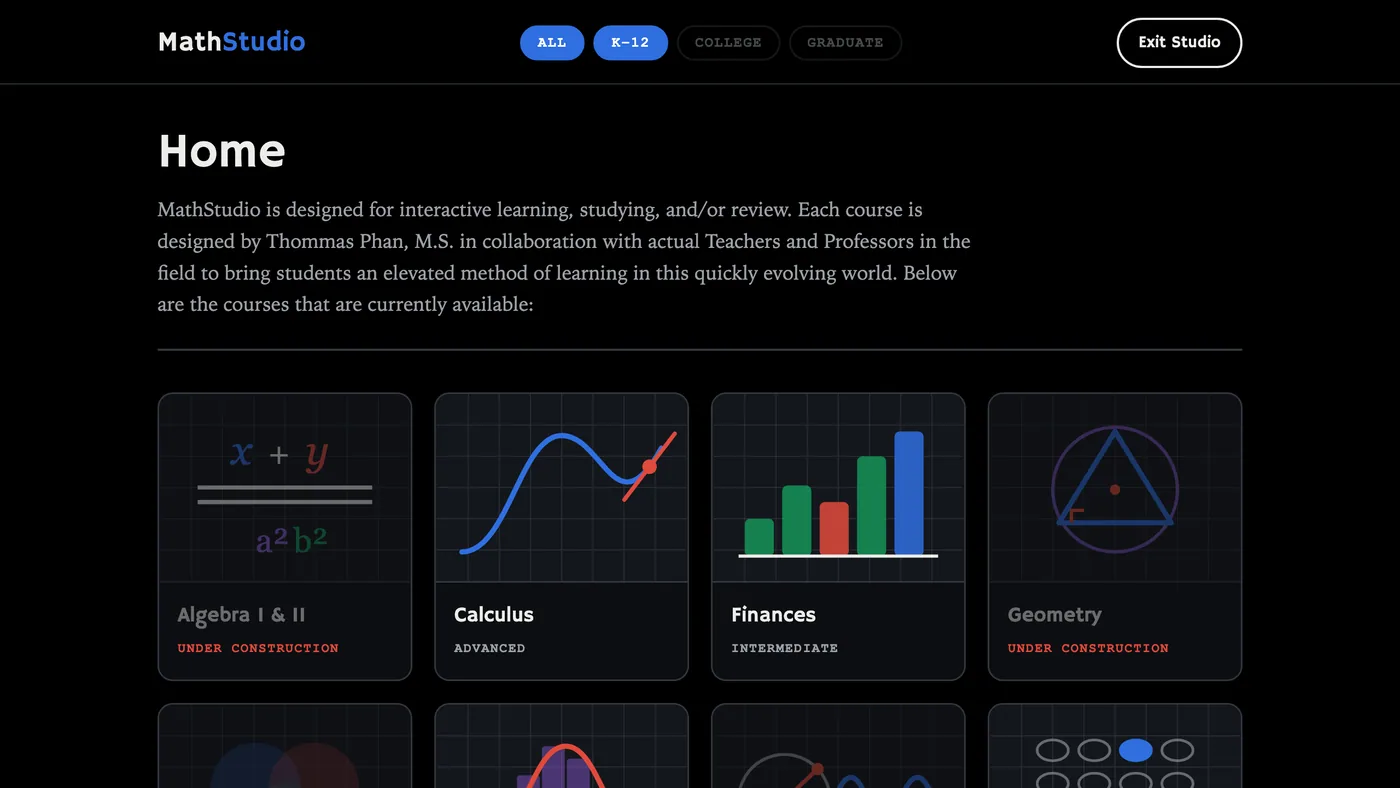
MathStudio is the third demo, and the odd one out: a second site with its own typeface, palette, dark mode, and navigation, living inside this one at /mathstudio. It is a working teaching platform rather than a mockup, which makes it the best evidence here that the stack holds up under something real.

Started in AAU across the guard and wing positions in a 3-and-D role, and later returned to the game as an assistant coach for a high school varsity program.
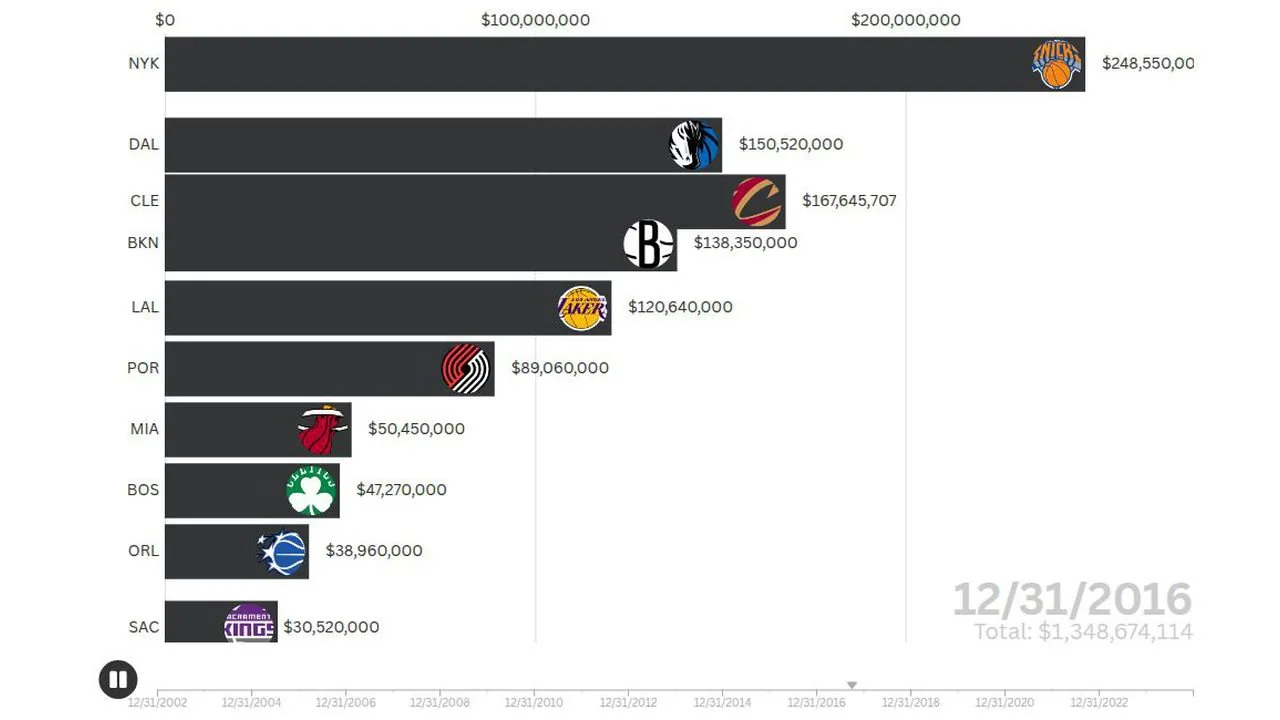
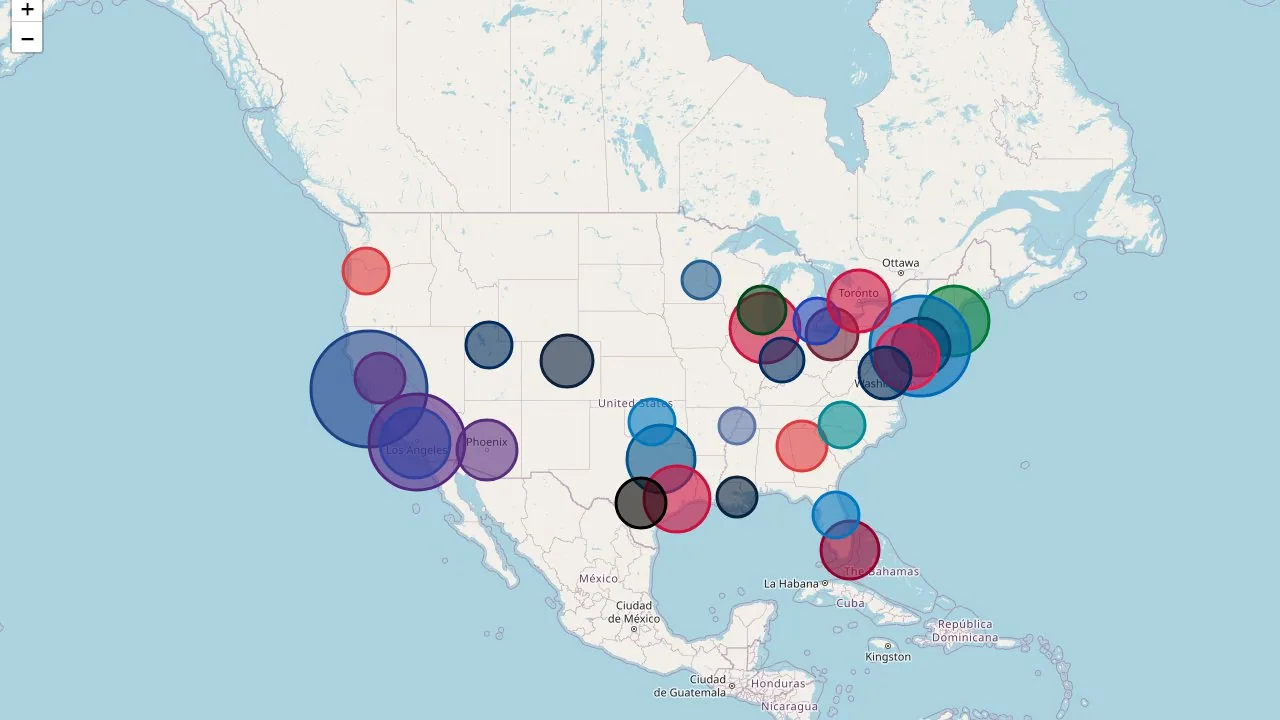
The playing turned into a data habit. I have spent years scraping box scores, injury reports, and franchise financials, and the charts and maps that came out of it are collected on the blog.
Most of that work fed a systematic review of NBA injury research, written after the 2024-25 season put Achilles ruptures back in the news. It covers the biomechanics of Achilles and ACL tears, the epidemiology and return-to-play outcomes, what the injuries cost teams, and the statistical methods used to model injury risk: survival analysis, ensemble classification, and deep learning with temporal attention.
Written up on the blog: Sports Leagues Data Science Visuals in HTML →

Competed through USAPL and finished ranked first nationally in the U18 83kg class, with a 441 lb squat, 314 lb bench, and 501 lb deadlift.
I came back to the sport at 23 and pushed those numbers to a 455 lb squat, 365 lb bench, and 530 lb deadlift.
Alongside competing I coached and trained more than a dozen lifters, writing programming and handling meet-day preparation.
Written up on the blog: My Powerlifting Journey →
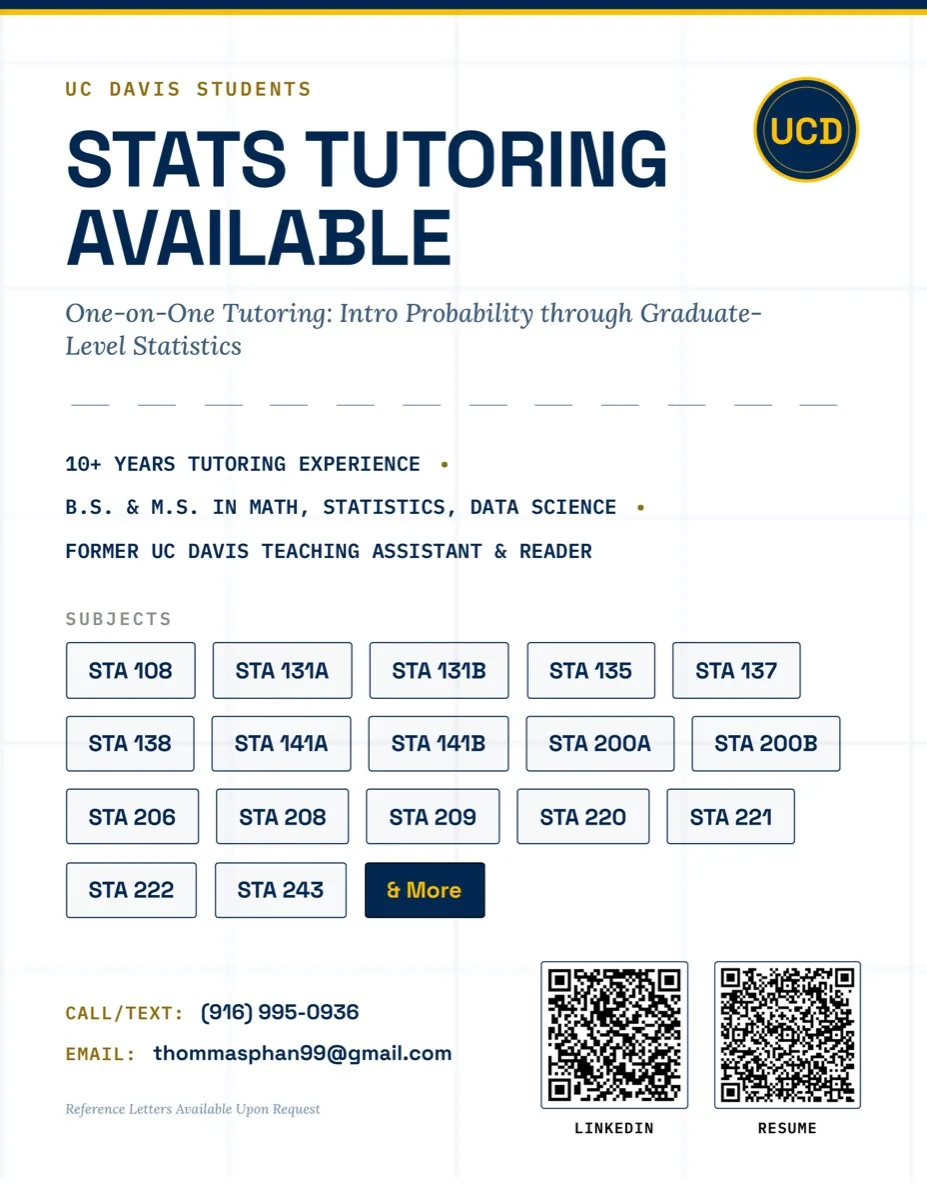
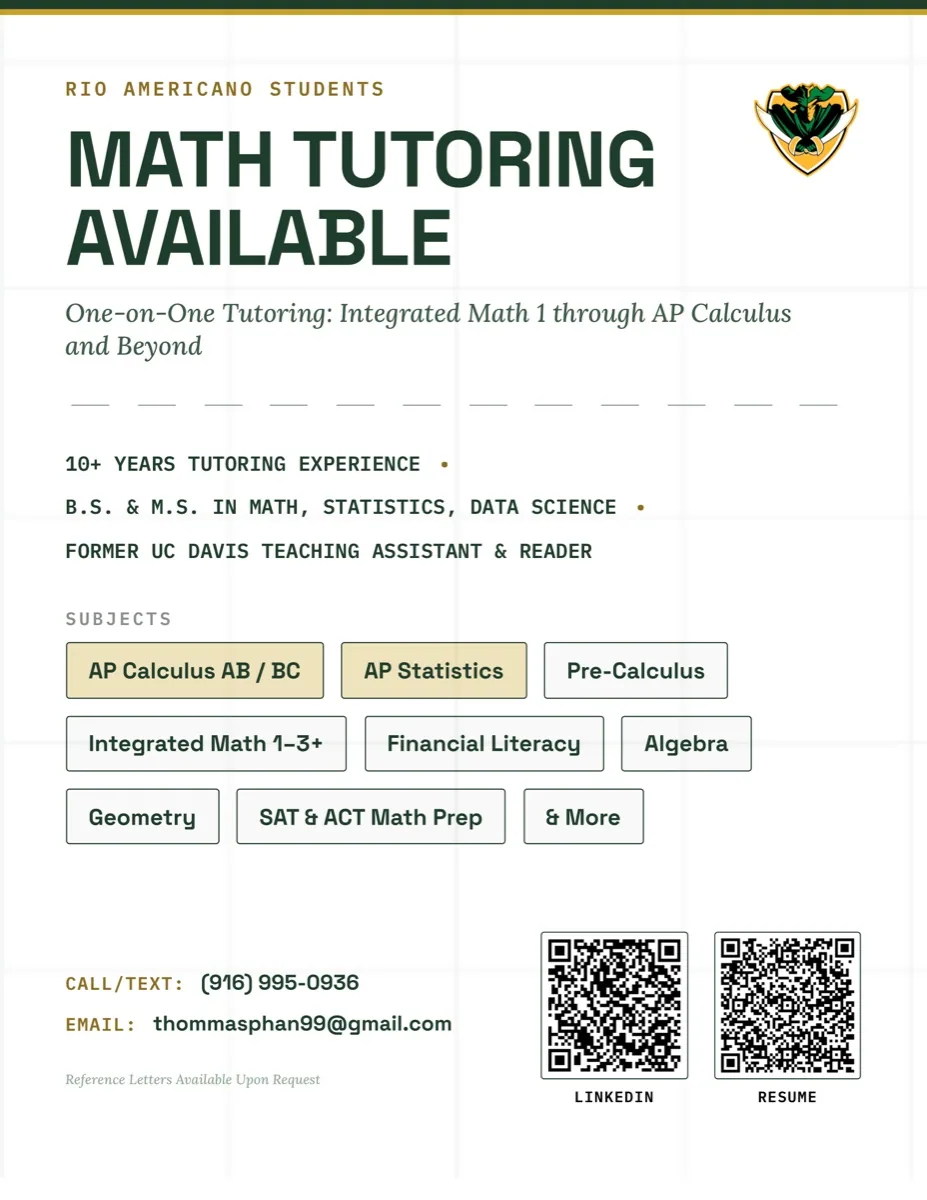
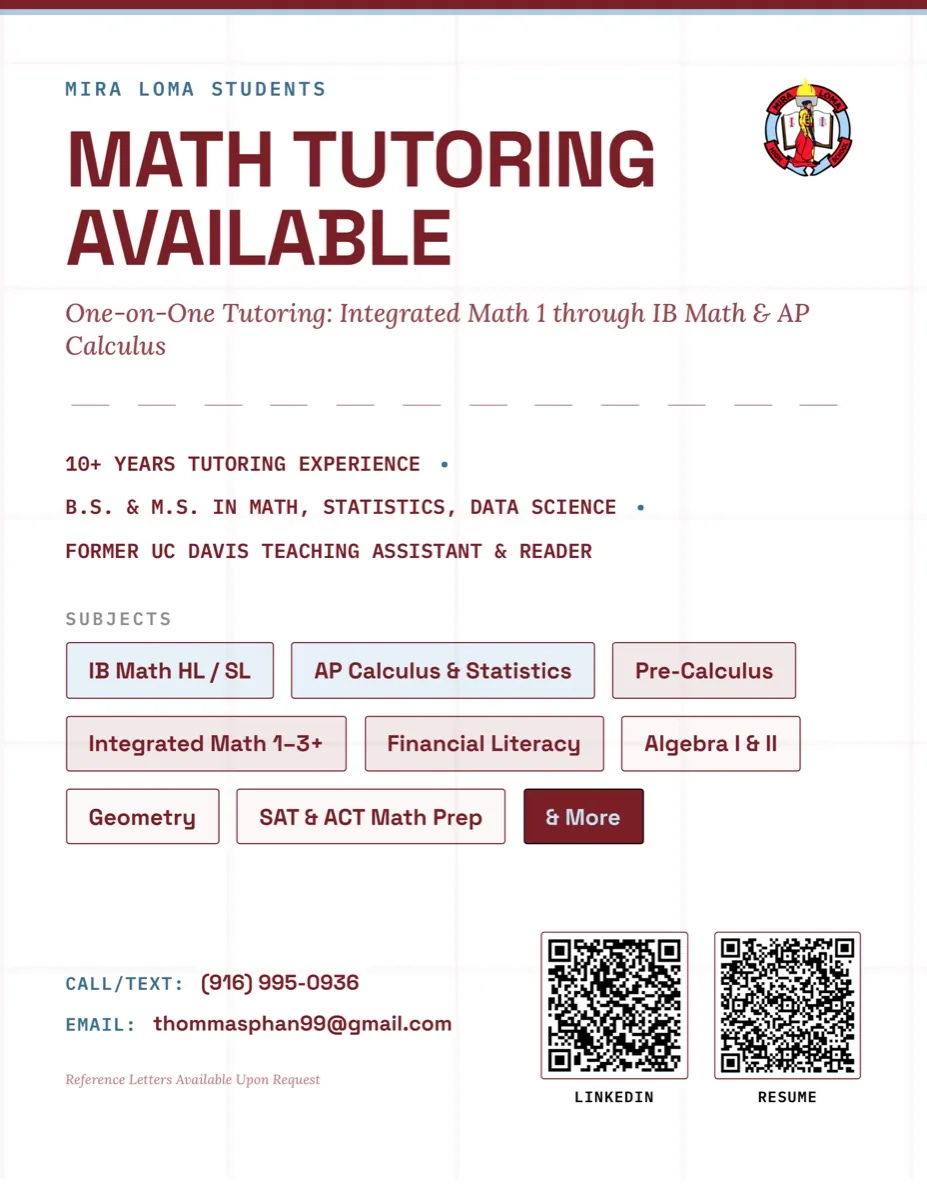
I have tutored independently since 2016, covering math, statistics, and English from elementary school through graduate coursework. Currently taking students.
Currently building MathStudio, a free, interactive course library for my students.